JavaScript is among the most open-source friendly languages. Thus, when faced with a question “why doesn’t it call this function?” or “What changes this property?”, most of the time we have the code of 3rd-party libraries ready and available for us to dive into for debug. Still, sometimes you only have the minified version of a library, or a normal version so big and complicated - you give up after pressing “step into method” over 30 times. You need to track the exact place where one of your objects properties is used.
Solution? Use Chrome and the most awesome feature of ES6 – Proxies! Your users are locked
into IE 8 and no ES6? What’s wrong with your organization? Ok, but you as
a developer, surely can use Chrome, just for this debug session?
Proxies are supported
by all modern browser releases for at least a year
, and current versions of Node.
To skip to the proxies part, click here
First case is easy. We have an object with a method, which is being used deep inside a library to do something, and not doing its job.
var strategy = {
    calculate: function(a,b,c){ return a + b + c;}
}

//we get NaN in console for some reason...
functionFromThirdPartyLibrary(strategy);

// some complicated code that ends up calling our function
function functionFromThirdPartyLibrary(strategy){
    // 10 kb of code
    setTimeout(function(){
        console.log(strategy.calculate(1,1));
    },10);
    // 10 more kb of code
}
That’s easy, we are in JavaScript land – we can wrap a method and intercept any calls!
var strategy = {
    calculate: function(){
        debugger;
        return strategyFromThirdPartyLibrary.apply(this,arguments);
    }
}

//we get NaN for some reason...
functionFromThirdPartyLibrary(strategy);

// some complicated code that ends up calling our function
function functionFromThirdPartyLibrary(strategy){
    // 10 kb of code
    setTimeout(function(){
        console.log(strategy.calculate(1,1));
    },10);
    // 10 more kb of code
}

function strategyFromThirdPartyLibrary(a,b,c){
    return a + b + c;
}
Now we will pause on any invocation and can examine our call stack.
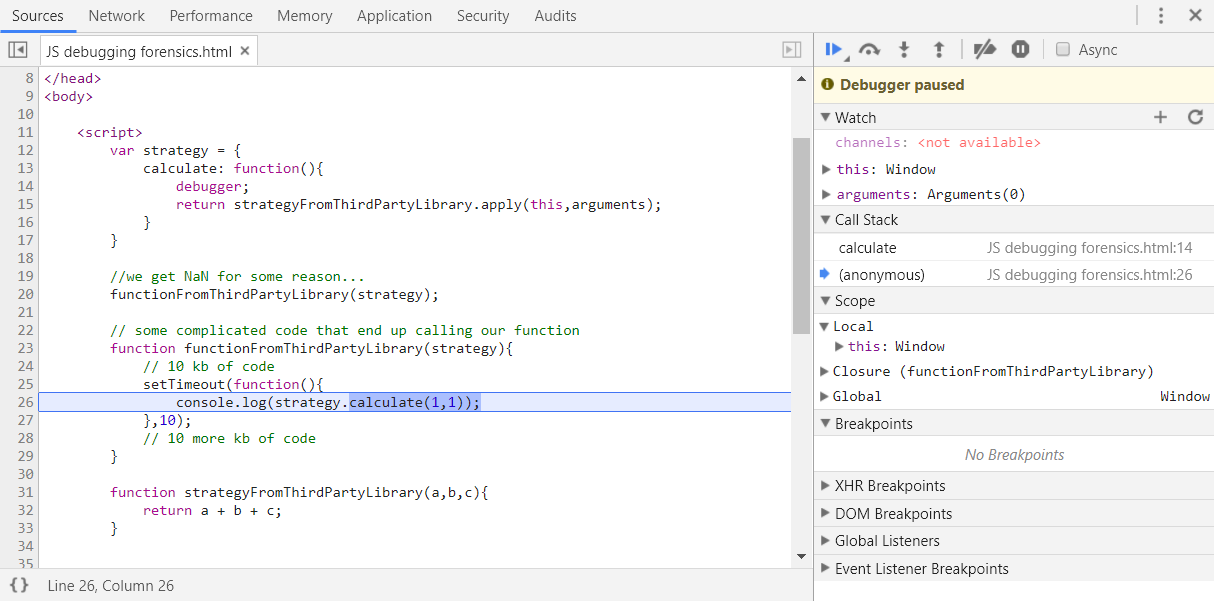
Sometimes, however, things are not as straight-forward. Remember, functions are also objects, as such, they can have properties, which your new wrapper function does not have. Sometimes, they may even be compared for referential equality inside the library. In this case, your wrapper may not work.
var strategy = {
    calculate: function(){
        debugger;
        return strategyFromThirdPartyLibrary.apply(this,arguments);
    }
}

//we get NaN for some reason...
functionFromThirdPartyLibrary(strategy);

// some complicated code that ends up calling our function
function functionFromThirdPartyLibrary(strategy){
    // 10 kb of code
    if(strategy.calculate.name === "strategyFromThirdPartyLibrary"){
        setTimeout(function(){
            console.log(strategy.calculate(1,1));
        },10);
    }
    // 10 more kb of code
}

function strategyFromThirdPartyLibrary(a,b,c){
    return a + b + c;
}
We need some way to insert a debugger into an existing function without otherwise modifying it. Chrome Dev Tools allows us to do just that with a ‘debug’ function: "debug(strategy.calculate)". We invoke it, pass in a reference to any other function, and dev tools will pause whenever an invocation occurs.
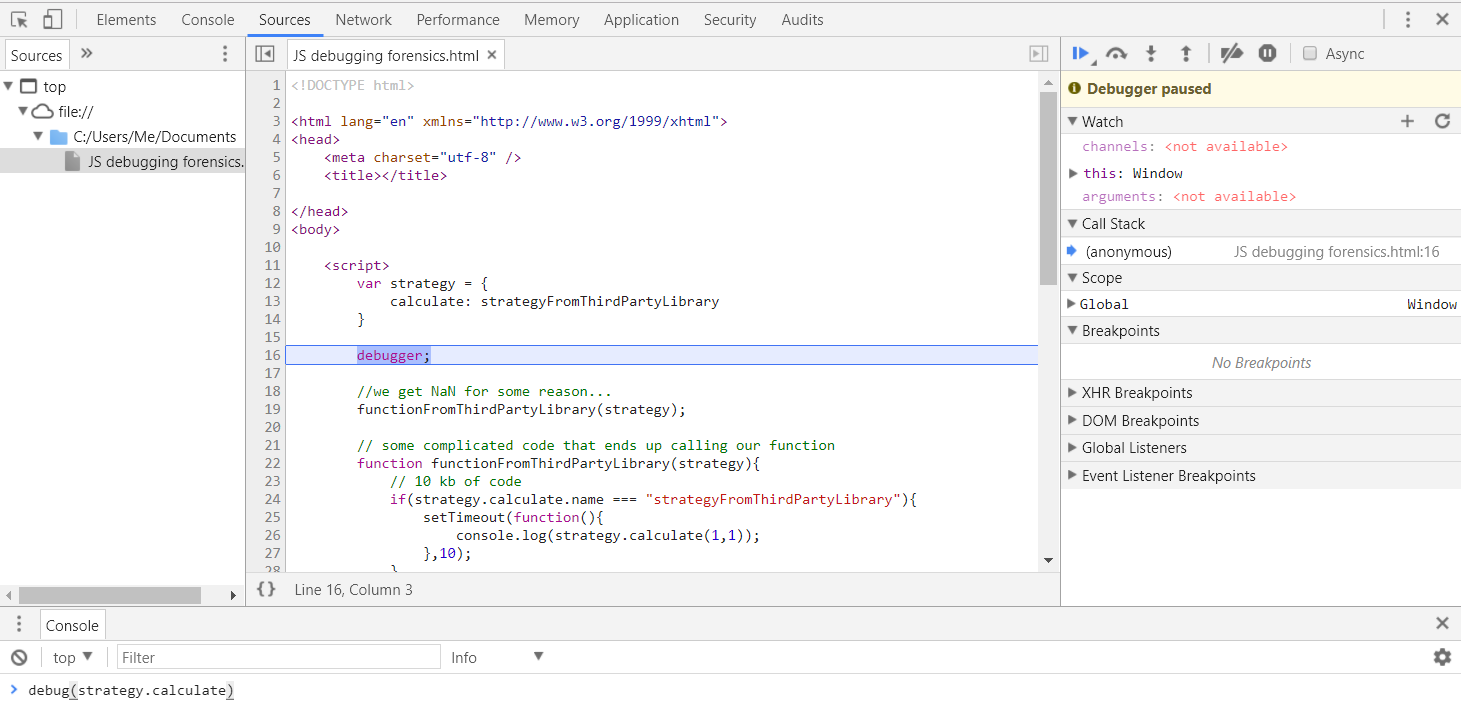
Remember, this ‘debug’ function is not part of normal runtime, and is available only via Chromes dev tools console.
Ok, debugging functions is easy. But what if we pass in a property, which gets misused? How do we find places where it is accessed or set? What if all of that happens via “obj[propName]”, so we have 0 chance to find it by name?
var config = {
    width: 100
}

functionFromThirdPartyLibrary(config);

// we get back 50. But what changes it???
console.log(config.width)

// some complicated code that ends up using our prop
function functionFromThirdPartyLibrary(config){
    // 10 kb of code
    if(config.width > 50){
        config.width = 50;
    }
    // 10 more kb of code
}
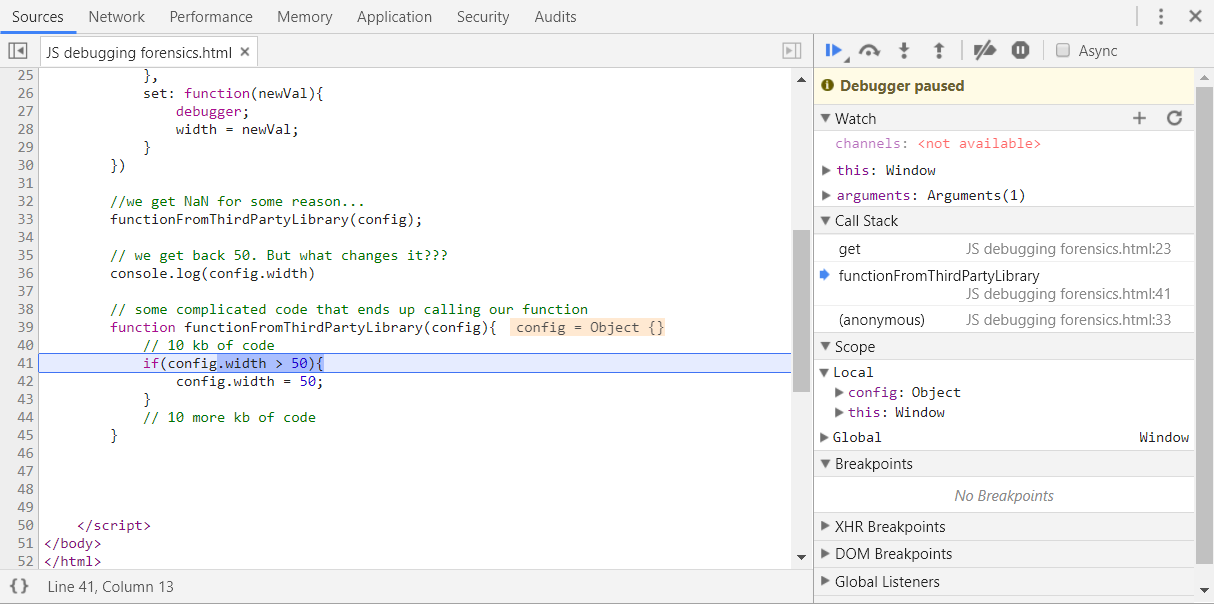
One of the rarer features of JavaScript are getters and setters – special functions whose invocation semantics looks like property access rather than normal functions. To the outside user hardly anything will change about the property, but we now have functions to work with, and can set breakpoints inside them. You can add getters and setters to an existing object via Object.defineProperty.
var config = {
    width: 100
}

// replace property with getter/sertter
var width = config.width;
delete config.width;

Object.defineProperty(config, "width", {
    get: function(){
        debugger;
        return width;
    },
    set: function(newVal){
        debugger;
        width = newVal;
    }
})

functionFromThirdPartyLibrary(config);

console.log(config.width)

// some complicated code that ends up using our prop
function functionFromThirdPartyLibrary(config){
    // 10 kb of code
    if(config.width > 50){
        config.width = 50;
    }
    // 10 more kb of code
}
And our debugger is hit again.
This will suffice for majority of our investigations. However, there are case, especially if dealing with bugs, when even this won’t be enough. Consider the next example, which does not even access the property value, but just checks its presence.
var config = {
    width: 100
}

functionFromThirdPartyLibrary(config);
// we should have gotten '100' in console, but somehow didn't


// some complicated code that ends up using our prop
function functionFromThirdPartyLibrary(config){
    // 10 kb of code
    // next line contains a bug. It should really check for true
    if(("width" in config) === false){
        console.log(config.width);
    }
    // 10 more kb of code
}
So, what about proxies?
Can we even do something here? Yes, we can. This is when the power of ES6 comes into play. One of ES6 most powerful and impactful features are Proxies. In short, they are special objects that take the concept of getters and setters even farther, allowing you provide special Trap methods that will handle a specific type of interaction with an object. i.e. getting or setting ANY property (including adding new ones), checking for presence of property, deleting a property, or even invoking the object like a function. There are traps for almost every type of interaction possible in JavaScript.
Power of proxies is evident from the simple fact, that they can’t be transpiled to ES5, they have to be supported by the runtime. We are yet to explore the possibilities they bring to the table, as supporting browsers spread. Suffice to say, if you’ve ever wanted your objects to be fully observable – proxies can give you that. I have a hunch, that the next-gen SPA frameworks will use them a lot.
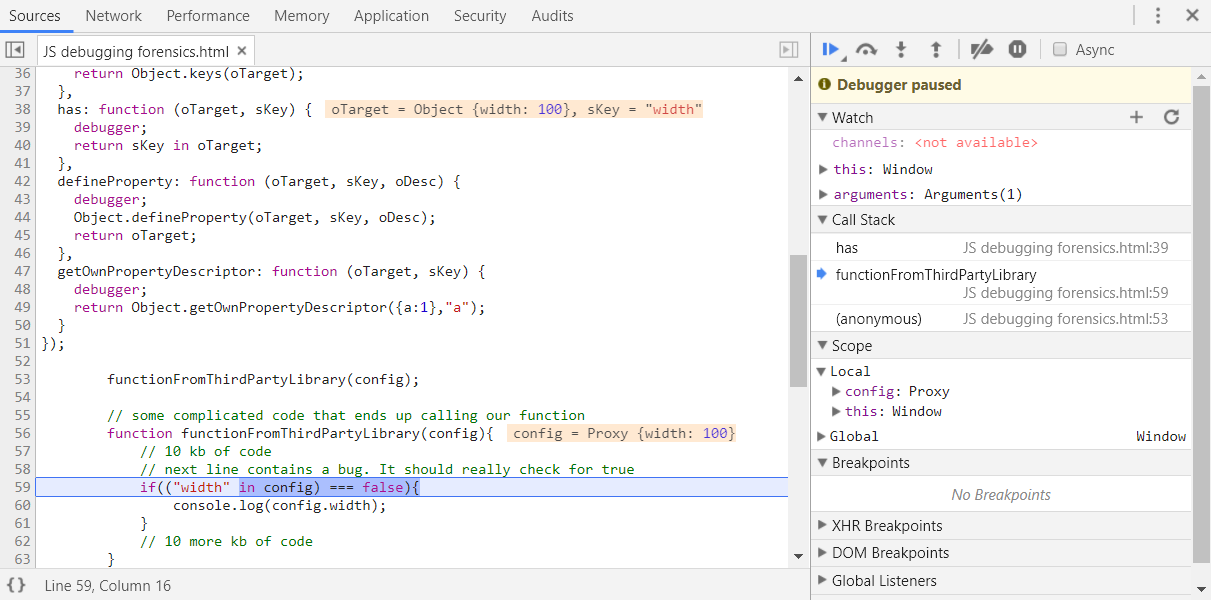
For now, let’s see how we can use them today to catch all interactions with our object. We will create a simple proxy, which will handle most possible interactions with an object, with only introduced change being a debugger statement to let us examine the circumstances, in which each interaction occurs.
// our initial object, it stores raw data
var config = {
    width: 100
}

// we substitute it for a proxy;
//it is passed as first argument, and all operations,
//for which the proxy does not have a trap,
//will be handled by it normally.
config = new Proxy(config, {
//we also get that object back as first argument in every trap call
get: function (oTarget, sKey) {
    debugger;
    return oTarget[sKey];
},
set: function (oTarget, sKey, vValue) {
    debugger;
    return oTarget[sKey] = vValue;
},
deleteProperty: function (oTarget, sKey) {
    debugger;
    return delete oTarget[sKey];
},
enumerate: function (oTarget, sKey) {
    debugger;
    return Object.keys(oTarget);
},
ownKeys: function (oTarget, sKey) {
    debugger;
    return Object.keys(oTarget);
},
has: function (oTarget, sKey) {
    debugger;
    return sKey in oTarget;
},
defineProperty: function (oTarget, sKey, oDesc) {
    debugger;
    Object.defineProperty(oTarget, sKey, oDesc);
    return oTarget;
},
getOwnPropertyDescriptor: function (oTarget, sKey) {
    debugger;
    return Object.getOwnPropertyDescriptor(oTarget, sKey);
}
});

functionFromThirdPartyLibrary(config);

// some complicated code that ends up using our prop
function functionFromThirdPartyLibrary(config){
    // 10 kb of code
    // next line contains a bug. It should really check for true
    if(("width" in config) === false){
        console.log(config.width);
    }
    // 10 more kb of code
}
And our debugger is hit again!
A word of advice, when investigating. Once you’ve found the place, which looks like it may be causing our issues – don’t try to write a fix for it immediately. First – correct it manually inside runtime debugger, and see, if that correction actually solves your problem. Only when manual correction works, should you start making a permanent fix.