This article will help you with debugging modern Web aps. ‘Modern’ here specifically means apps where source code undergoes a major transformation before execution, e.g. you are using Babel to enable features from ES2015-ES2018, TypeScript, and/or frameworks like Mobx that rely on transformations like decorators and transpile down to ES5. Because of the above, code that is actually executed by JS runtime is very different from what you see in your IDE.
You may be thinking, ‘but we’ve got source maps !’ While source maps are good, transforming ES2015-ES2018 features into ES5 changes code too dramatically, a single source line often becomes 3 or more during execution, this becomes _this, variable names change due to transpilation of let and const into var, etc. All of these changes really mess with debugging features like step over or examining variable values by their name. Debugging it can be a pain, but it does not have to.
Sample project for this article is avaliable on GithubHint 0 - browser tools
These are the essentials of JS debugging. Make sure you are familiar with Chrome debugging capabilities. They are VERY mature and really let you get into things. Specifically: JS debugging reference and extra capabilities of chrome console . Make sure you read about blackboxing and debug(function).
Also, go to Chrome store, look for dev tools extensions for any frameworks you are using and familiarize yourself with their capabilities. With frameworks like React / Angular / Vue such extensions let us examine inner state of our UI much easier. For example, in React:

- Click icon to start selection an element visually.
- Select a button.
- Inspect its props, right click function ‘onClick’ and store it as global variable.
- In the console enter debug($tmp).
- Click button in UI – viola, we are paused inside our click handler.
Typical debug experience
You’ve paused inside a click handler, you press F11 to step into a function and …you find yourself in a piece of code that should not be executing ever, like at the beginning of class declaration. You go into Chrome settings to disable source maps and see yourself inside code like this:
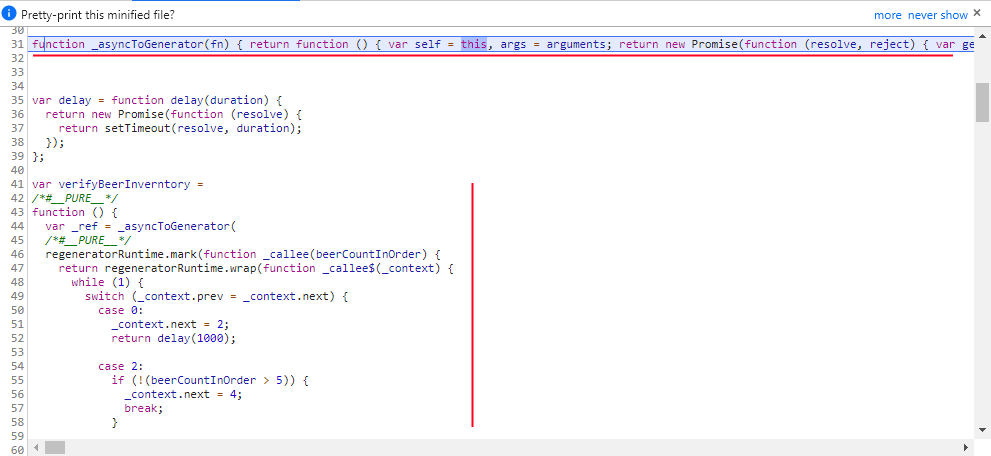
This code is great! No really, we should be greatful for it - this is what async is transpiled into, and what lets us use async today without having to look back at older browsers. But it is also tedious to debug.
Hint 1 – you actually have a modern browser
Transpiling our code all the way down to ES5 is a good idea,
but that does not mean we can’t use a different target for transpilation
for local debug. Assuming you are using well-updated Chrome for debug, you can change the
transpilation target of Babel to produce ES2018 and keep all its features intact.
Here is a sample how to change webpack.config.js for Babel loader. Don't forget to run
npm i -D @babel/preset-env
:
 module: {
    rules: [
        {
            test: /\.(js|jsx)$/,
            exclude: /node_modules/,
            use: {
                loader: 'babel-loader',
                options: {
                    presets: [
                        // present-env controls,
                        // how far back are we targeting
                        ['@babel/preset-env', {
                            "targets": {
                                //"chrome": 1,
                                "chrome": 72
                            }
                        }]
                    ]
                }
            }
        }]
    }
Or, if you use TypeScript compiler, tsconfig.json:
{
    "compilerOptions": {
        "target": "es2018"
     }
}
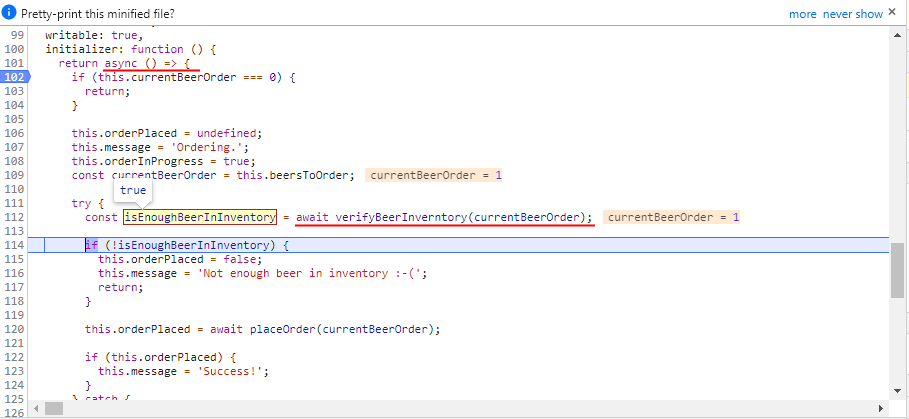
If you now debug again - your async function will be intact. Variable names are now unchanged due to availability of const, let and fat-arrow functions, stepping works as expected. You can even turn source maps back on. For plain JS they will only hide code generated by decorator transformations, but for something like TypeScript they can still be usefull.
Word of warning. After you enable ES2015, you get browser native const and let keywords. Unlike var, accessing such variables before assignment throws an error. This may cause an issue if your modules had circular dependencies:
//a.js
import { B } from './b';

export const foo = 5;

//b.js
import { C } from './c';

export class B { };

//c.js
import { foo } from './a';

// with ES5 'var', you would just get undefined,
// but with 'const' you get an error if you access foo
// before it is set to 5
if (foo) {
    console.log(foo);
}

export class C { }
A quick fix to continue debugging would be to temporarily change export to use var. Circular dependencies are a sign of bad system design, so, make sure you fix them asap.
Hint 2 – separate 3-rd party code into a chunk and blackbox it
Ok, now we have our ES2018 code, we are paused right before the function we want to debug.

Let’s step in. This is not my function?
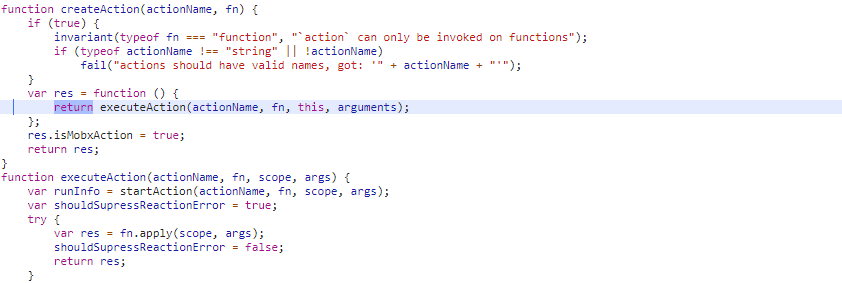
Our functions use decorators, a very powerful tool (spec is currently being changed, but Babel supports previous version with a plugin). This particular variety comes from Mobx, we are using @action. Drilling inside framework code waiting to reach your business logic can be quite tedious. But we can split all 3-rd party libs like React and Mobx into a separate script (chunk) and blackbox it. This would mean functionality like 'step into function' will ignore all code from that file and take us all the way to our code. Here is webpack chunking reference. In our demo webpack.config.js:
  output: {
        path: path.join(__dirname, 'dist'),
        filename: '[name].bundle.js',
        chunkFilename: '[name].bundle.js',
        publicPath: '/dist/'
    },
    optimization: {
        splitChunks: {
            cacheGroups: {
                vendors: {
                    test: /[\\/]node_modules[\\/]/,
                    name: 'vendors',
                    enforce: true,
                    chunks: 'all'
                }
            }
        }
    },
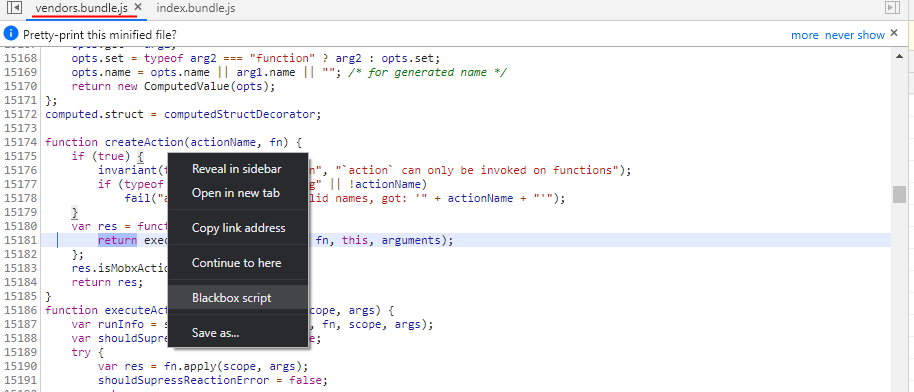
Dont forget to load the bundle with '<script src="/dist/vendors.bundle.js"></script>' Now Mobx will end up in vendors.bundle.js, and next time you hit it - you can right-click anywhere in the file and blackbox it all. 'step into function' will now take you all the way to your code in one click.
Summary
With these hints, your runtime code now looks and debugs almost exactly like your source code, which will make business logic exploration and bug-hunting much easier. Good luck!